Infographics are an excellent way of sharing information in a very engaging way. It would be awesome if you could do it just by one click. Now you can, thanks to AI! This article will show you how to make professional-looking infographics with ease—no design skills necessary—with the help of a text-to-infographic generator. Perfect for designers and those who aren’t.
Table of Contents : How to Create Piktochart infographics
Introduction to Piktochart Step by Step Guide😎
In this fast-moving world, visual content plays a very huge role. It helps capture attention and puts information into simple visuals that are easy to understand. But to make them from scratch takes time, not to mention design skills. Luckily, tools like Pictochart allow any user to create professional-looking infographics in just a few seconds. With just one click, your text will be turned into a beautiful-looking infographic with no design skill required.
Piktochart Tutorial
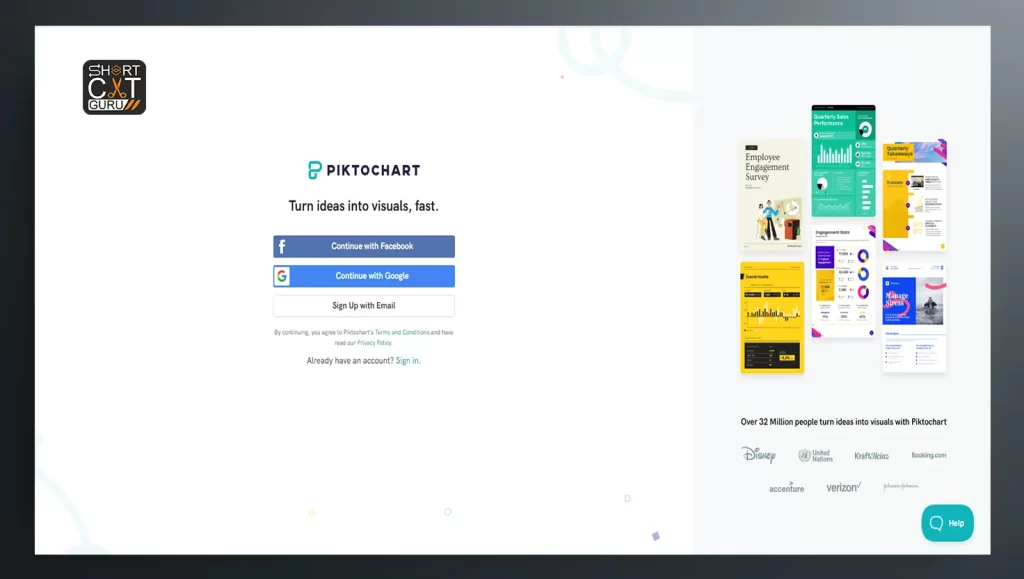
Step 1: Sign Up or Log In to Pik to chart 🚀
Go into Piktochart or make an account before you start..
- Visit Piktochart website: www.piktochart.com
- Sign up or log in: If new, then click “Sign Up” and follow the process. Go in right now if you have an account.
Step 2: Choosing a Template 🎨
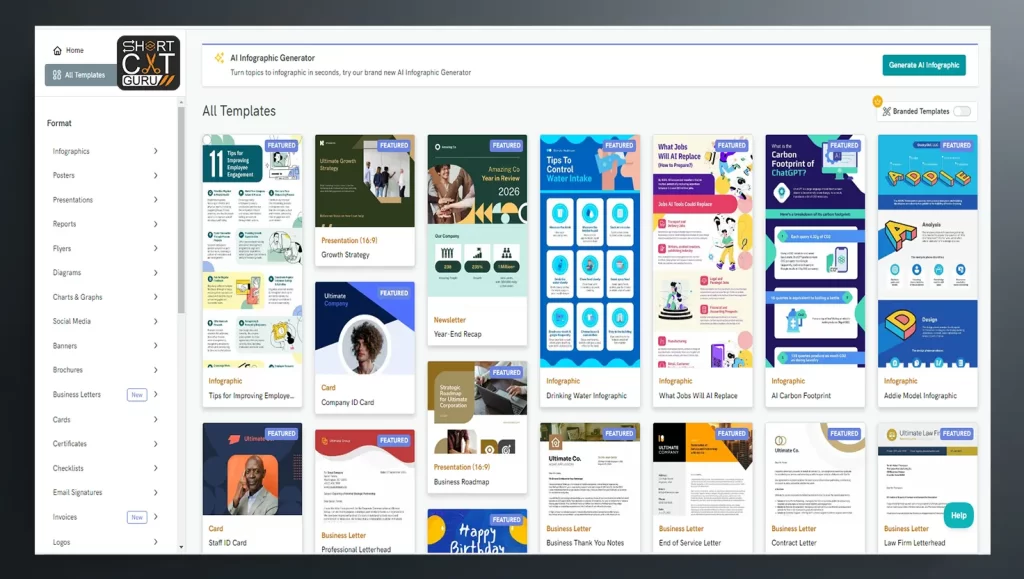
Piktochart has a wide variety of templates for your infographic. Selecting a Template: Do the following:
- To access the Templates section: Choose “Templates” from the menu in the top bar after logging in..
- Infographics: From the dropdown, select “Infographics.”
- Explore the templates: From the well-structured categories, pick a template that will suit your needs.
Step 3: Customize Your Infographic 🎨🖌️
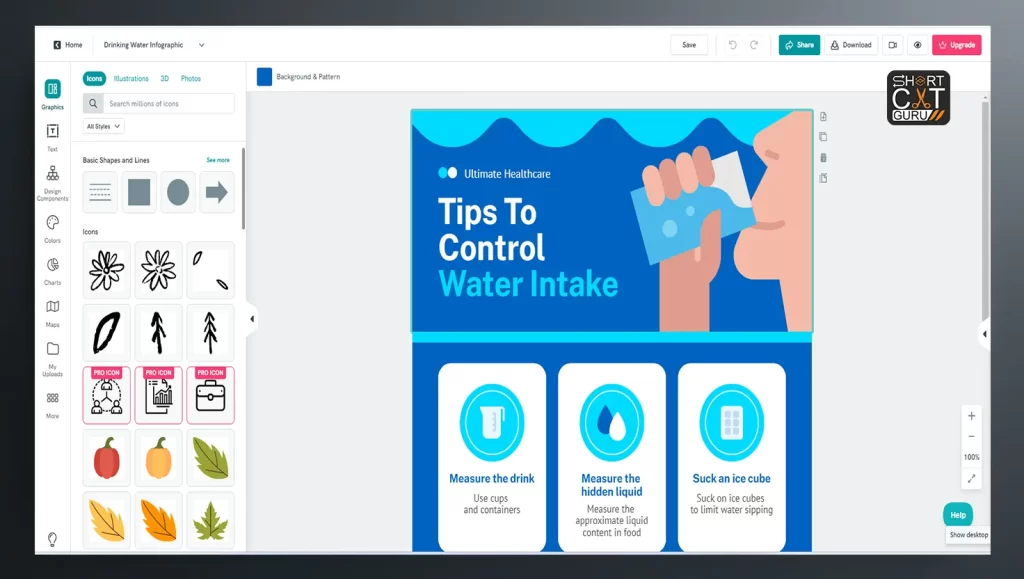
Now, edit whatever is needed in your chosen template to fit your content.
- Editing text: In the template, start editing any of the text boxes with your content.
- Changing Fonts: Tap any of the text boxes and then select from the dropdown to change the fonts.
- Add icons and images: By clicking on the “Graphics” tab, you will gain access to Piktochart’s huge library of icons and images.
- Color up: Color your elements to brand or theme by selecting elements and using the color picker.
Step 4: Add Charts and Visualizations 📊
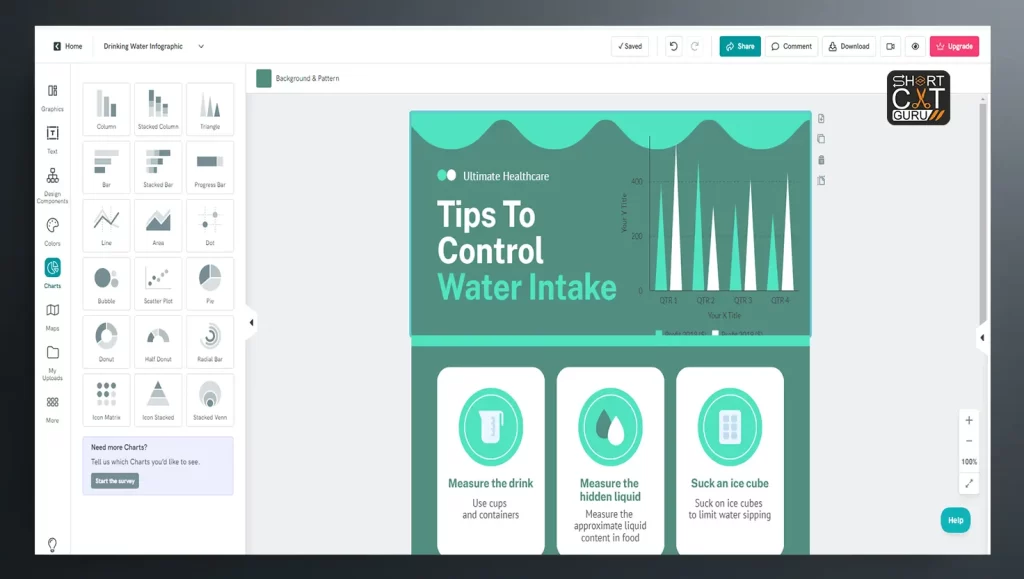
Piktochart makes data visualizations easy to do. This is how you add charts:
- Slect the Charts tab: Click to display the “Charts” menu.
- Chart Type Selection: From bar charts to pie charts, line graphs, and many more.
- Enter Data: You can upload your data manually, but it’s much easier to just upload a CSV file.
- Customizing Your Chart: Colors, labels, and all other settings can be adjusted according to your design.
Step 5: Add Images and Visual Elements 📷
You will bring an infographic to life by adding images to it. Piktochart allows users to upload their own or use those provided in the library.
- Upload Images: Click “Uploads” and drag your images into the platform.
- Placing Images in Infographic: Drag the uploaded images on to your infographic canvas.
- Frames for Images: Piktochart has a variety of frames that will let you give unique shapes to the images.
Step 6: Final Revisions and Infographic Downloads ✅
Now that you are satisfied with your design, it’s time to complete the finishing touches on your infographic and download it.
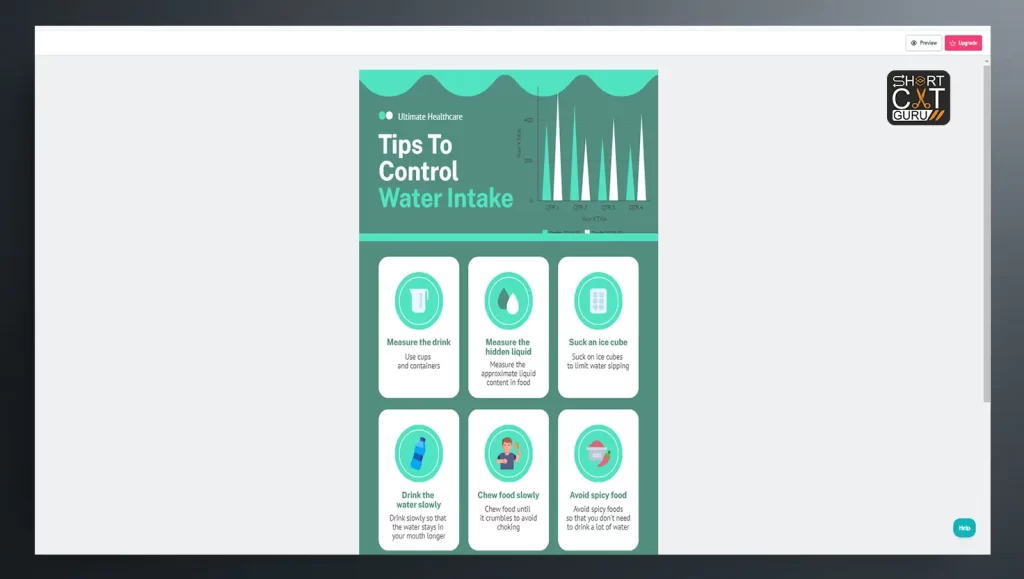
- Preview your infographic: The “Preview” button will allow you to see your infographic as it will appear when downloaded.
- Final touches: If something is off, come back and adjust it accordingly.
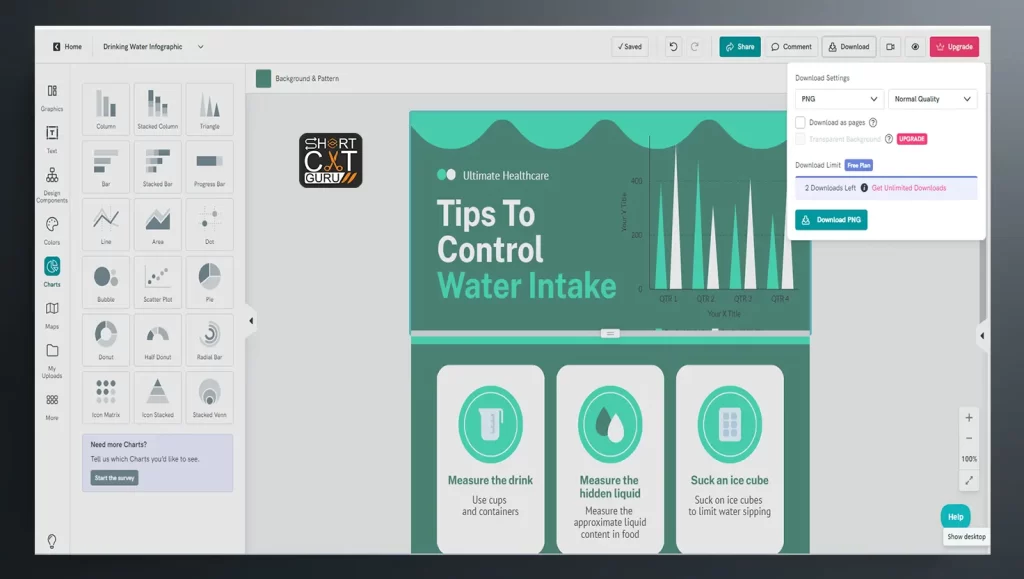
- Download your infographic: Click the “Download” button now, save it to your computer in a format of your choice (PNG, PDF, etc.), and open it.
Example: Making an Infographic on “The Benefits of Remote Work” 🏡💻
Now, design an infographic on the benefits associated with working remotely.
- Pick a Template: For this example, pick a template that has a balanced amount of text and images.
- Edit Text: Replace the placeholder text with points like “Increased Productivity,” “Better Work-Life Balance,” and “Cost Savings.”
- Add Icons: Use icons for a scale, dollar signs, and something that depicts productivity to give each benefit a visual representation.
- Add Graphs: Add a pie chart indicating the percentage of remote workers who said they were more satisfied with their jobs.
- Finalize and Save: Preview and save your downloaded infographic when you have colored it with a calm, professional color scheme.
Additional Features
Replace Images 🖼️ Edit and Replace
Photos may be easily edited and changed with drag and drop. Alternatively, upload your own photos and arrange them in your infographic to achieve the desired look.
Example:
- Upload your logo in image format regarding your company.
- Drag and drop into the infographic.
Showcasing Infographics on Websites 🌐
Now that you have created your infographic, the time has come to flaunt it. You’ve already completed half the work if your website is WordPress. Webspace Kit is one of the tools which will let you host infographics without any hassle.
Example:
- Use Webspace Kit to construct a WordPress website.
- Upload your infographic as part of a blog post.
Embed Infographics on a Website 🔗
Make your site engaging by embedding your infographic in posts or pages. Pictochart will provide you with an embed code for your WordPress site. This makes sure that your infographics are perfect and look stunning on any device.
Example:
- Copy the code provided for embedding by Pictochart
- Copy and paste it into your WordPress website’s HTML block.
Additional AI Tools Mentioned 🤖
Other AI tools, including Gravity Write, can also be helpful in accomplishing this task. It has templates for blogs, social media, among others, making it fast and effective.
Example:
- Use Gravity Write to draft a blog entry.
- Bundle the blog with your infographic to complete the content package.
Piktochart Infographic Pros & Cons
Piktochart is ideal for use in the ease of creating an infographic. However, it may not be able to give advanced users what they need—users who want finer control over design.
Pros of Piktochart 👍
- Piktochart: A User-Friendly Tool to Make Infographics
- An excellent tool for creating infographics is Piktochart. Even for a new beginner, it will be easy to handle. For customization, it has a drag-and-drop interface.
- It has templates for all kinds of uses. Be it infographics, presentations, or reports, Piktochart has got you covered.
- You can add colors, fonts, images, and icons to your designs in order to make them completely harmonious with your brand or your project.
- Making charts and graphs is pretty easy with Piktochart. This will let you represent data clearly and with visualization.
- Collaboration in Piktochart is not a problem since many users are allowed to work on a project simultaneously. This is ideal for teamwork assignments or even professional use.
- Since it is web-based, you can log in to Piktochart from any device that has an internet connection. This truly makes it very easy for you to edit on the move.
- You can use Piktochart for free with their basic plan. In fact, there is no cost associated with creating and downloading infographics.
Cons of Piktochart 👎
- It has some limits to the free plan. You won’t be able to download files in higher resolution or use templates. Piktochart will put a watermark on your work.
- For advanced designers, Piktochart will not cater to them as it doesn’t provide adequate provision for customization. It’s really not that powerful compared with professional design software like Adobe Illustrator.
- Getting access to the full features and high-resolution downloads requires you to pay for the subscription, which is where the price becomes quite high for some.
- This could affect performance in the case of intricate designs or slow internet connections. As Piktochart is web-based, there would be times where it could get slow.
- Basically, Piktochart does static infographics; it does not provide advanced animation or interactive features like the other platforms do.
- A few templates might turn out very common; thus, if not well customized, it will lead to a lack of uniqueness.
FAQ 🤔
Q1: Is Piktochart free?
Yes, you can use Piktochart for free. However, most of the advanced features like downloading in high resolution require a paid plan.
Q2: How do I share my info-graphics directly from Piktochart?
Your infographic can be embedded on your website or shared with a link. Direct social media sharing is another feature available in Piktochart.
Q3: Can I collaborate on an Infographic in Piktochart with others?
Yes. Piktochart does support real-time collaboration for people to work on an infographic together.
Q4: Can I animate anything in Piktochart infographics?
Piktochart is oriented towards static infographics, but you have the ability to add some kind of simple animations for web use.
Q5: How do I make my infographic mobile-friendly?
While designing your infographic, do an upright layout. On mobile devices, reading gets easier. Keep the text at a minimum to avoid clutter.
Conclusion 🎯
Creating stunning infographics with Piktochart is easier than you think. By choosing the right template, customizing it with your own text and visuals, and exporting in the best format, you can turn complex information into engaging, shareable content in minutes. Whether you’re a beginner or an experienced designer, following these steps will help you create professional-quality infographics that grab attention and deliver your message effectively. Now it’s your turn — open Piktochart and start designing today!





Your article helped me a lot, is there any more related content? Thanks!
Thanks for sharing. I read many of your blog posts, cool, your blog is very good.